Nyc Population Table
TableQuestion
The first table below shows changes in the total population of New York City from 1800 to 2000. The second and third tables show changes in the population of the five districts of the city (Manhattan, Brooklyn, Bronx, Queens, Staten Island) over the same period.
Summarise the information by selecting and reporting the main features, and make comparisons where relevant.
Write at least 150 words.
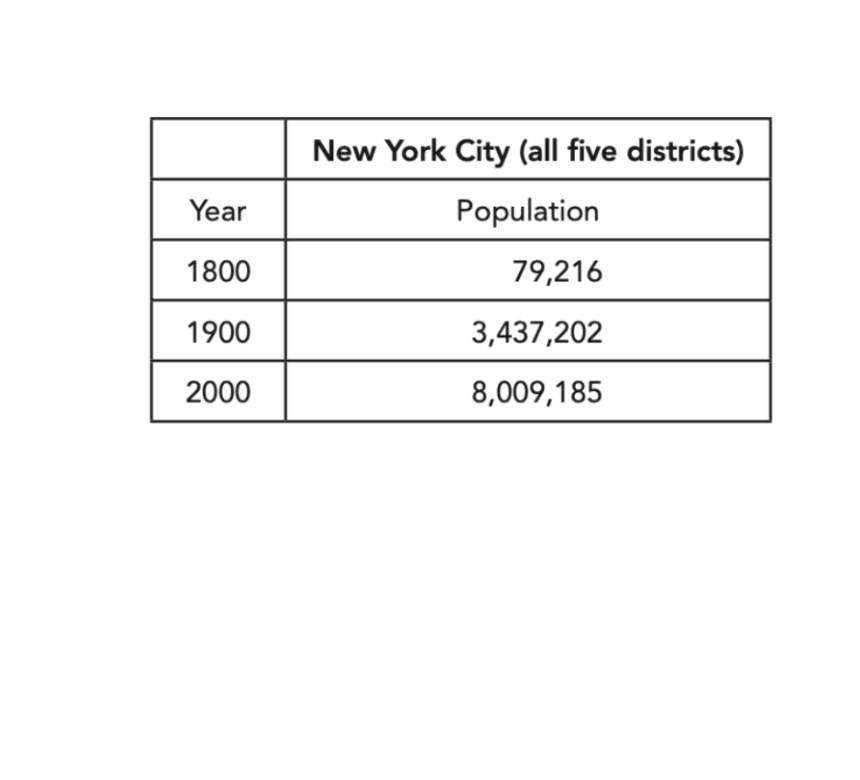
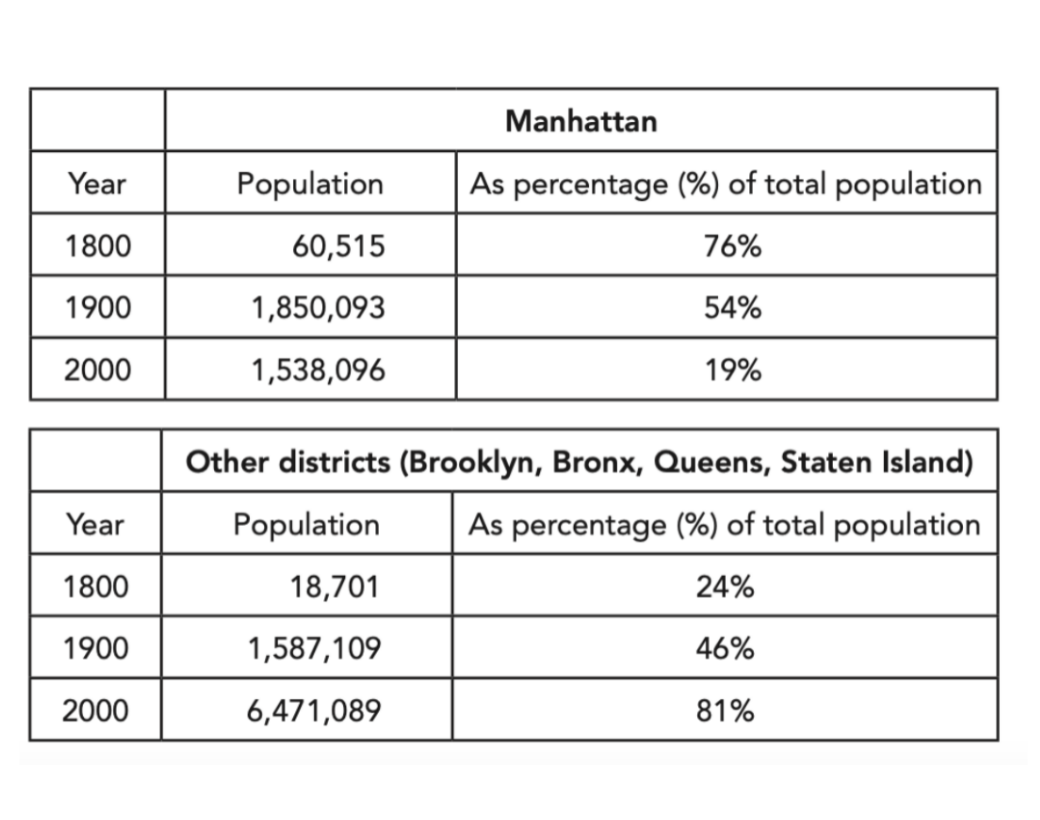
The tables show how the population of New York City changed between 1800 and 2000, and how the balance between Manhattan and the four outer districts shifted over the same period.
Overall, the city's population grew dramatically, and the distribution of residents reversed: in 1800 Manhattan held three-quarters of the population, but by 2000 the outer districts accounted for well over four-fifths of the total.
The city as a whole grew from 79,216 in 1800 to 3,437,202 in 1900 and then more than doubled to 8,009,185 by 2000. Manhattan's population followed a different path, rising from 60,515 in 1800 to a peak of 1,850,093 in 1900, before falling back to 1,538,096 by 2000. As a share of the city, however, Manhattan fell continuously — from 76% in 1800 and 54% in 1900 to just 19% by 2000.
The outer districts, by contrast, grew steadily, from only 18,701 people in 1800 to 1,587,109 in 1900 and 6,471,081 in 2000. Their share of the population rose from 24% to 81% over the same period, so that by the end of the period they were home to the vast majority of New Yorkers.
Analysis
Task Response
The overview captures the two essential movements — the city's enormous growth and the population shift from Manhattan-dominated to outer-district-dominated. It reports both absolute numbers and percentage shares, so the reader sees each district's growth and its changing share.
Takeaway: for a table task, always report a proportion insight (X's share rose/fell) as well as the raw figures — "who held the majority" is the high-value comparison in population tables.
Coherence & Cohesion
The report is split logically: overview → total city → Manhattan (the declining share) → outer districts (the rising share). Pairing the two districts that move in opposite directions makes the comparison the organising principle.
Takeaway: group by directional contrast (a rising line against a falling one) rather than by order of appearance — the comparison tightens the paragraph structure.
Lexical Resource
Number reporting is precise and varied: "more than doubled", "rose to a peak", "fell back", "held three-quarters", "accounted for", "well over four-fifths." The shift verbs ("the balance... reversed", "the vast majority") carry the ranking change clearly.
Takeaway: rotate reporting verbs (rise, peak, fall back, account for, hold, make up) and use fraction vocabulary (three-quarters, four-fifths, a share of) so the numbers never read as a list.
Grammatical Range & Accuracy
Complex structures keep the figures flowing: "before falling back to..." (participle), "as a share of the city, however, Manhattan fell continuously" (fronted adverbial with contrast), and "so that by the end of the period they were home to..." (result clause).
Takeaway: use fronted adverbials ("as a share of the city", "by contrast") and result clauses ("so that") to vary sentence openings and link figures within one sentence.