Urbanisation Asian
Task 1Question
The graph below gives information about the percentage of the population in four Asian countries living in cities from 1970 to 2020, with predictions for 2030 and 2040.
Summarise the information by selecting and reporting the main features, and make comparisons where relevant.
Write at least 150 words.
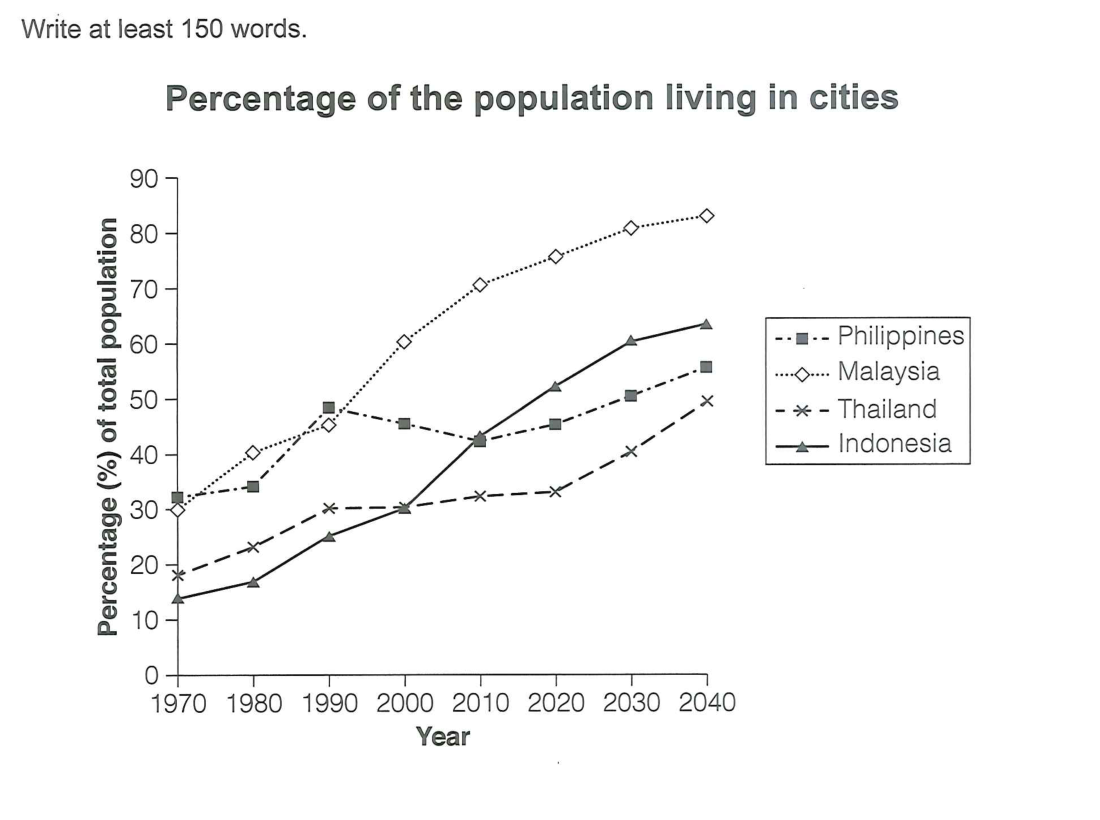
The line graph shows the share of the population living in cities in four Asian countries between 1970 and 2020, together with projections to 2040.
Overall, urbanisation rose in all four countries, but at very different rates. Malaysia saw the steepest and most sustained increase, ending as the most urbanised country, while the Philippines — despite starting with the highest proportion — grew most slowly and lost its lead.
Malaysia began at around 30% in 1970 and climbed steeply, passing 50% in the mid-1990s and reaching roughly 76% by 2020, with a forecast of about 83% by 2040. Indonesia also grew strongly, from the lowest base of about 15% in 1970 to over 50% by 2020, and is projected to reach around 63% by 2040, overtaking Thailand around 2000 and narrowing the gap to the Philippines.
The Philippines started highest, at roughly 33%, but its growth was comparatively slow, dipping around 1990 and 2010 before recovering to about 47% by 2020 and a projected 55% in 2040. Thailand rose more steadily from roughly 20% in 1970 to about 36% by 2020, with a forecast of around 50% by 2040, leaving it the least urbanised of the four throughout.
Analysis
Task Response
The overview delivers the two key insights — urbanisation rose everywhere, and the country that started highest (Philippines) was overtaken by the one that climbed steepest (Malaysia). It captures the "who ends on top" comparison rather than just listing four rising lines.
Takeaway: for a multi-line graph, find the crossover story (who loses the lead, who gains it) and put that in the overview — it's the difference between describing and analysing.
Coherence & Cohesion
The paragraphs compare on the basis of growth rate: the two fast-risers (Malaysia, Indonesia) in one paragraph and the two slower/plateauing ones (Philippines, Thailand) in the next. This pairs contrasting lines from the outset.
Takeaway: group the fastest-growth country with the second-fastest, and the starter-high-slow-growth with the low-and-slow — separating the "climbers" from the "plateauers" gives a natural two-body structure.
Lexical Resource
Change verbs are varied and precise: "climbed sharply", "rose more steadily", "grew most slowly", "dipped slightly", "overtaking." Ranking terms ("the most urbanised", "the least urbanised", "lost its lead") carry the comparative weight.
Takeaway: use a gradient of growth verbs (climb, soar, rise steadily, grow slowly, dip, plateau, overtake) and ranking language (the most/least urbanised, overtake, lose its lead) to keep a four-line graph from becoming repetitive.
Grammatical Range & Accuracy
The essay uses participial and result structures: "despite starting with the highest proportion" (contrast-participle), "leaving it the least urbanised of the four" (result-participle), and "with a forecast of about 83% by 2040" (prepositional projection).
Takeaway: use "despite starting..." / "leaving it..." (participle clauses) and "with a forecast of..." to compress the trend-and-projection logic into fewer, richer sentences.