Police Budget
Pie ChartQuestion
The table and charts below give information on the police budget for 2017 and 2018 in one area of Britain. The table shows where the money came from and the charts show how it was distributed.
Summarise the information by selecting and reporting the main features, and make comparisons where relevant.
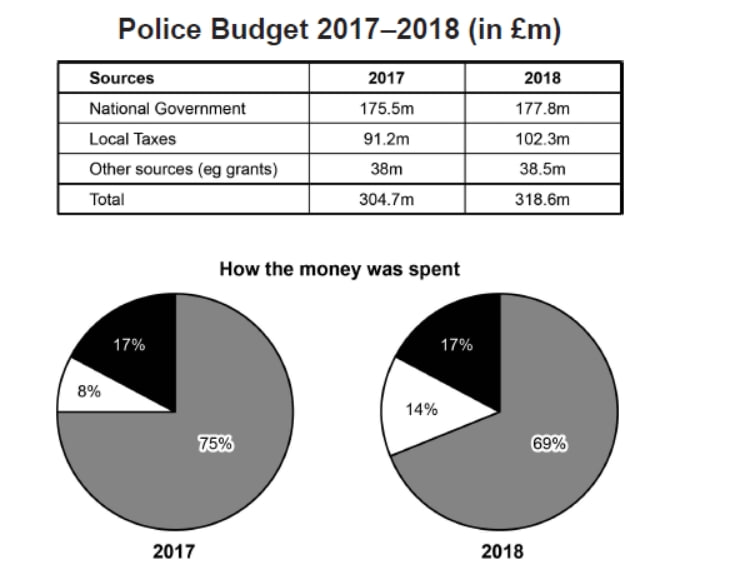

The table and pie charts show how the police budget in one area of Britain was funded and spent in 2017 and 2018.
Overall, the total police budget increased, driven primarily by a rise in local tax contributions. In terms of expenditure, salaries remained the dominant cost, though their share declined as spending on technology grew at the expense of staffing.
The total budget rose from £304.7m in 2017 to £318.6m in 2018, an increase of £13.9m. The National Government remained the largest funding source — £175.5m in 2017 and £177.8m in 2018 — though its growth was modest. Local tax contributions jumped from £91.2m to £102.3m, an increase of over £11m. By contrast, income from other sources, such as grants, edged up only marginally, from £38.0m to £38.5m.
On spending, salaries for officers and staff fell from 75% of the budget in 2017 to 69% in 2018. Technology spending nearly doubled, rising from 8% to 14%, mirroring the six-point drop in the salary share. Expenditure on buildings and transport held steady at 17% across both years, the only category to show no change.
Analysis
Task Response
The overview paragraph addresses both data dimensions — funding sources and expenditure — in two tightly linked sentences. "Driven primarily by a rise in local tax contributions" attaches cause to the overall budget increase, which is a level above simply reporting "it went up." The second sentence captures the trade-off dynamic: "salaries remained the dominant cost, though their share declined as spending on technology grew at the expense of staffing." Identifying this inverse relationship — technology up, salaries down — is the central insight of the data set, and placing it in the overview is correct prioritisation.
Data selection shows discipline. The essay reports the total (£304.7m → £318.6m), the absolute change (£13.9m), and all three funding sources with figures. But it does not mechanically list every percentage point — the National Government's increase is summarised as "modest" rather than spelled out in detail, which is appropriate because its change (+£2.3m) is far smaller than local tax (+£11.1m). The writer chooses what to emphasise based on significance, not completeness.
The expenditure paragraph quantifies the most striking changes precisely: "from 8% to 14%" (technology nearly doubling) and "at 17% across both years" (buildings static). The phrase "the only category to show no change" singles out stability as noteworthy — in a data set full of movement, stasis is itself a feature worth highlighting.
Comparisons are embedded in reporting, not tacked on. "By contrast, income from other sources, such as grants, edged up only marginally" contrasts with the local tax jump. "Mirroring the six-point drop in the salary share" links two separate data points (technology +6pp, salaries -6pp) into a single relationship — the writer sees the data as a system, not a list.
Reusable technique: For dual-source Task 1s (table + chart), the overview must capture one key point from each source in a single paragraph. When two categories move in opposite directions by the same margin, use "mirroring" or "offset by" to show you understand the relationship, not just the individual numbers. Only quote exact figures for the most significant changes; summarise smaller movements with adverbs (modestly, marginally, slightly).
Coherence & Cohesion
The overview establishes the essay's organisational logic through vocabulary rather than signposting. "In terms of expenditure" signals the second half of the overview without "secondly." The reader understands the essay will follow the same two-part structure — funding, then spending — because the overview has already mapped the territory.
Paragraph transitions are content-driven. "On spending" moves from funding to expenditure by referencing the topic directly, which is more natural than "Turning now to the pie charts." The transition also echoes the overview's "in terms of expenditure" — a subtle lexical chain that reinforces structure without repetition.
Causal linking appears in the overview itself: "driven primarily by a rise in local tax contributions." This is a participle phrase functioning as an adverbial of cause — grammatically compact but logically rich. A weaker essay would write "The total budget increased. The main reason was local tax." The participle phrase collapses cause and effect into one clause.
The concessive "though their share declined" embedded in the overview's second sentence creates internal tension: salaries dominate but are shrinking. This prepares the reader for the technology-vs-salaries dynamic without needing a separate "however" sentence.
Cross-paragraph cohesion is strongest in "mirroring the six-point drop in the salary share." This participial phrase in the expenditure paragraph reaches back to the funding trend (salaries declining) and ties the two paragraphs together. The reader realises the 6pp shift from salaries to technology is the essay's organising insight — and the grammar makes that connection explicit.
Reusable technique: Use participle phrases for causal and comparative cohesion: "driven primarily by…", "mirroring the…", "offset by a corresponding rise in…". Place your key cross-data insight in a participial phrase at the end of a body paragraph sentence — it links backward and adds analysis simultaneously.
Lexical Resource
The essay demonstrates a calibrated range of increase verbs, each carrying a different magnitude. "Rose from… to…" is neutral and used for the overall total. "Jumped from… to…" signals a sharp increase (local tax +£11.1m). "Edged up only marginally, from… to…" describes minimal movement (other sources +£0.5m). No two increases use the same verb — and each verb's intensity matches the data it describes.
For describing stability and near-stasis, the essay uses three distinct expressions: "edged up only marginally" (other sources — tiny change treated as near-stasis), "held steady" (buildings — no change), and "the only category to show no change" (buildings again, but now as a distinguishing feature). The progression from describing what happened ("edged up only marginally") to evaluating significance ("the only category") shows lexical resource used for analytical purpose, not just variety.
The phrase "at the expense of staffing" in the overview is a single collocation that communicates trade-off. It implies that technology's gain is salaries' loss — a zero-sum reading of the budget — without needing a separate sentence to explain the relationship. "At the expense of" is a high-value chunk for any Task 1 where one category's growth coincides with another's decline.
"Nearly doubled" is more precise than "increased significantly" — it quantifies the magnitude (8% → 14% is nearly double) while acknowledging it is not exactly double. "Mirroring" is a standout lexical choice: it frames two independent data points as reflections of each other, which is an analytical insight dressed as vocabulary.
Reusable technique: Build a four-tier increase vocabulary: rose/increased (neutral), grew (moderate), jumped/surged (large), edged up/crept up (minimal). For stability: held steady, showed no change, was unchanged. For near-stasis: edged up marginally, crept up slightly. For trade-offs: "at the expense of," "offset by," "mirroring." Match the verb intensity to the data magnitude every time.
Grammatical Range & Accuracy
The overview opens with a participle phrase as an adverbial of cause: "driven primarily by a rise in local tax contributions." This structure subordinates the cause inside the result clause, avoiding a two-sentence "The budget increased. This was because local tax rose." It is both more concise and more sophisticated.
Parenthetical dashes embed data inside clauses without breaking syntax: "The National Government remained the largest funding source — £175.5m in 2017 and £177.8m in 2018 — though its growth was modest." The dashes insert the two-year data pair as an appositive clarification, then the main clause resumes with a concessive subordinator. This is cleaner than writing "The National Government provided £175.5m in 2017 and £177.8m in 2018" as a separate sentence, which would waste words on a modest change.
Appositive noun phrases add layered data reporting: "Local tax contributions jumped from £91.2m to £102.3m, an increase of over £11m." The appositive ("an increase of over £11m") quantifies the jump without requiring a separate sentence. This compact post-modification — reporting the movement and its magnitude in one clause — is a hallmark of efficient academic prose.
The expenditure paragraph uses a gerund subject: "Expenditure on buildings and transport held steady at 17% across both years." Starting a sentence with a nominalised verb phrase ("Expenditure on…") rather than "The amount spent on…" demonstrates grammatical range through nominalisation — a key discriminator in academic writing.
The participial phrase "mirroring the six-point drop in the salary share" at the end of the technology sentence is grammatically ambitious. It attaches a comparative observation to a data-reporting sentence, turning "Technology rose to 14%" from a fact into an argument. The -ing form makes the mirroring simultaneous with the increase — the grammar says "these two things are the same phenomenon seen from different angles."
Reusable technique: Use participle phrases for cause ("driven by"), comparison ("mirroring," "offset by"), and simultaneity. Use parenthetical dashes to embed two-year data pairs inside a single clause. Post-modify subjects with appositive noun phrases for layered data reporting ("local tax contributions, an increase of over £11m"). Use nominalised subjects ("Expenditure on…," "Spending on…," "The proportion devoted to…") instead of "The amount spent on…" for academic register.